Math Kangaroo 2021 — Student
0/30 answered
75:00
1
3 pts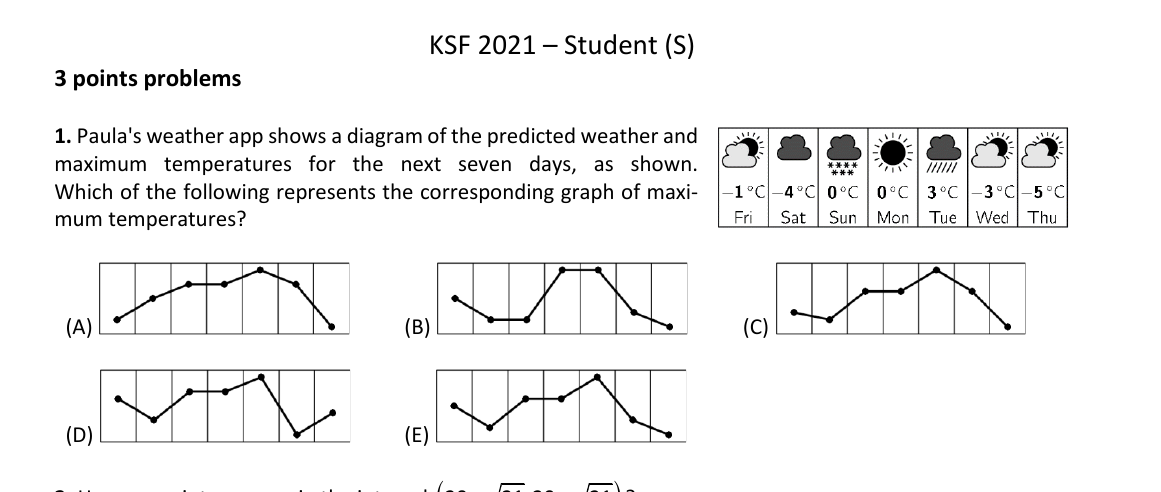
Paula's weather app shows a diagram of the predicted weather and maximum temperatures for the next seven days, as shown. Which of the following represents the corresponding graph of maxi- mum temperatures?
Questions
Answered
Marked
Unanswered